Introducing
Motilal Oswal 5 Year G-Sec FoF
(An open ended fund of funds scheme investing in units of Motilal Oswal 5 Year G-Sec ETF)
5 Benefits for a bright future
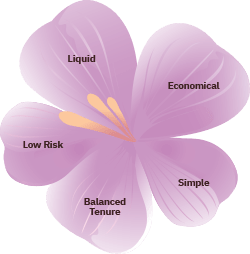
- Low Risk: Exposure to Government backed securities
- Liquid: Underlying G-Sec is one of the most liquid security
- Economical: Invests into low cost passive fund
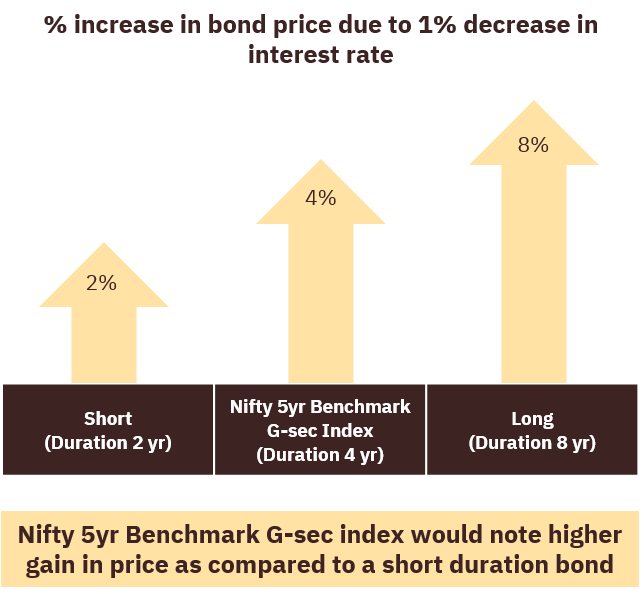
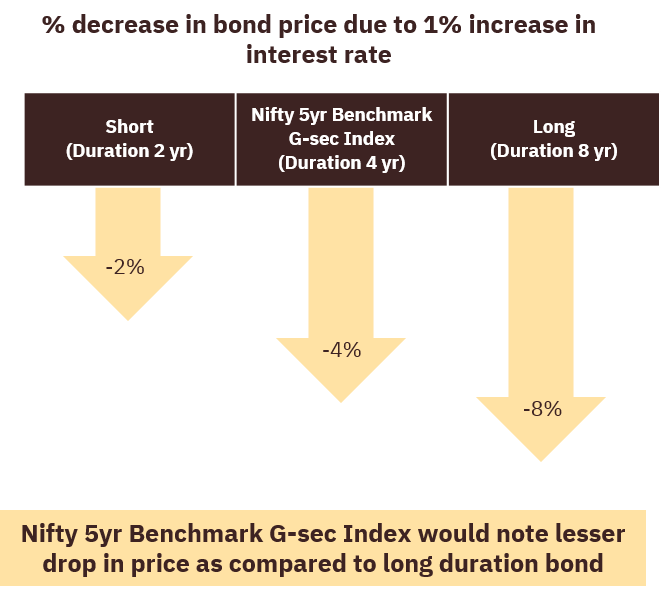
- Balanced Tenure: Falls in a sweet spot between short & long duration
- Simple: Easy access to Govt Debt Security