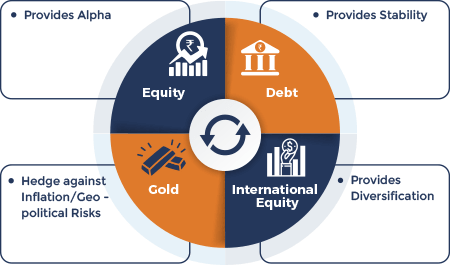
Every asset class has a role to play and contributes its own set of properties to give us a final asset allocation with properties much different from the properties of the original ingredients.
| Instruments | Allocations (% of total assets) |
Risk Profile | |
|---|---|---|---|
| Minimum | Maximum | High / Medium / Low | |
| Equity, Equity related instruments and International Equity Index Funds/ Equity ETFs^ | 10 | 50 | High |
| Debt, Money Market Instruments | 40 | 80 | Medium |
| Gold Exchange Traded Funds | 10 | 20 | Medium |
^As per SEBI Circular no. SEBI/HO/IMD/DF3/CIR/P/2017/114 dated October 6, 2017, Foreign Securities will not be treated as a separate asset class and accordingly International Equity Index Funds/Equity ETFs have been included in Equity and Equity related instruments. The scheme intends to invest in International Equity Index Funds/Equity ETFs upto 20% of net assets.

Minimum Returns
Maximum Returns
Average Returns
4.03%
16.42%
10.31%
2.25%
13.02%
6.97%
-5.01%
60.28%
16.85%
Negative Observations
0% to 4%
0
0

0%
observations
0
348

9.2%
observations
130
347

11.3%
observations
4% to 6%
6% to 8%
72
128
726
1694
258
305
8% to 10%
10% to 12%
12% to 14%
14% to 16%
Above 16%
1630
1376
463
101
18

94.7%
observations
704
249
67
0
0

26.9%
observations
342
419
376
285
1375

73.8%
observations
Source: Bloomberg and MOAMC Internal research. Disclaimer: The above data is used to explain the concept and is for illustration purpose only and should not used for development or implementation of an investment strategy. Past performance may or may not be sustained in future.
Backtested, hypothetical or simulated performance results have inherent limitations. Simulated results are achieved by the retroactive application of a backtested model itself designed with the benefit of past observations. The backtesting of performance differs from the actual account performance because the investment strategy may be adjusted at any time, for any reason and can continue to be changed until desired or better performance results are achieved. Alternative modeling techniques or assumptions might produce significantly different results and prove to be more appropriate. Past hypothetical backtest results are neither an indicator nor a guarantee of future returns. Actual results will vary from the analysis. Past performance should not be taken as an indication or guarantee of future performance, and no representation or warranty, expressed or implied is made regarding future performance.
With "0%" of observations below 4% and ~ 95% of observations falling in above 8% returns for 3 year rolling period across 18 years test case period
Total number of observations are 3788. Returns are calculated on a daily rolling basis. Back-test returns are gross of expenses.
|
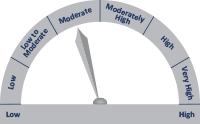
Riskometer 
Investors understand that their principal will be at |
|
