Motilal Oswal Multi Asset Fund
(An open ended scheme investing in Equity including Index Funds/Equity ETFs, Gold ETFs and Silver ETFs,International Equity ETF and Stocks, Debt & Money Market Instruments.)
July 2023
Fund Manager |
For Equity Mr. Santosh Singh Managing this fund w.e.f. Jan 01, 2022 He has overall 15 years of experience. Debt, Gold and Silver Component Mr. Rakesh Shetty Managing this fund since 22-Nov-2022 He has a rich experience of more than 14 years For International Equity Mr. Ankush Sood He has been appointed as the Fund Manager for Foreign securities w.e.f. August 25, 2021. |
Benchmark: |
20% Nifty 50 TRI + 65% Crisil Short Term Bond Index + 13% Domestic Price of Gold + 2% Domestic Price of Silver |
Monthly AAUM |
₹ 112.74 cr |
|---|---|
Latest AUM (31-July-2023) |
₹ 113.15 cr |
Market Capitalization |
|
Market Cap |
Weightage (%) |
| Large Cap | 36% |
| Mid Cap | 16% |
| Small Cap | 48% |
Top 5 Stocks |
|
Stocks |
(%) of Holding |
Fino Payments Bank Ltd |
6.3 |
| Religare Enterprises Ltd | 5.7 |
Star Health And Allied Insurance Company Ltd |
3.5 |
eMudhra Ltd |
3.0 |
ZF Commercial Vehicle Control Systems India Ltd |
2.9 |
| Category | Multi Asset Allocation |
| Date of Allotment | 4-August-2020 |
| Continuous Offer | Minimum Application Amount : ₹ 500/- and in
multiples of ₹1 /- thereafter. Additional Application Amount : ₹ 500/- and in multiples of ₹1/- thereafter. |
| Redemption proceeds | Normally within 2 Business days from acceptance of redemption request |
| Entry / Exit Load | Entry Load: Nil 1%- If redeemed on or before 3 months from the date of allotment. Nil- If redeemed after 3 months from the date of allotment.No Exit Load applies for switch/ STP from Motilal Oswal Multi Asset Fund to Motilal Oswal Focused Fund, Motilal Oswal Midcap Fund, Motilal Oswal Flexi Cap Fund, Motilal Oswal Equity Hybrid Fund, Motilal Oswal Large and Midcap Fund, Motilal Oswal Long Term Equity Fund (Subject to Lock-in Period) & Motilal Oswal Balanced Advantage Fund or any other schemes as may be amended by AMC and vice versa. |
| Investment Objective | The investment objective is to generate long
term capital appreciation by investing in
Equity including Index Funds/Equity ETFs,
Gold ETFs and Silver ETFs, International Equity
ETF and Stocks, Debt & Money Market
Instruments. However, there can be no assurance or guarantee that the investment objective of the Scheme would be achieved. |
| Total Expenses Ratio | Direct: 0.93% Regular: 2.03% |
Scrip |
Weightage
(%) |
| Equity & Equity Related | |
| Fino Payments Bank Ltd. | 6.3% |
| Religare Enterprises Ltd. | 5.7% |
| Star Health And Allied Insurance Company Ltd. | 3.5% |
| eMudhra Ltd. | 3.0% |
| ZF Commercial Vehicle Control Systems India Ltd. | 2.9% |
| Samvardhana Motherson International Ltd. | 2.7% |
| MTAR Technologies Ltd. | 2.3% |
| Archean Chemical Industries Ltd. | 2.3% |
| ICICI Bank Ltd. | 1.9% |
| Dr. Reddy's Laboratories Ltd. | 1.5% |
| Infosys Ltd. | 1.4% |
| Tata Consultancy Services Ltd. | 1.4% |
| State Bank of India | 1.4% |
| LTIMindtree Ltd. | 1.3% |
| UltraTech Cement Ltd. | 1.2% |
| Larsen & Toubro Ltd. | 1.2% |
| Maruti Suzuki India Ltd. | 0.8% |
| Total | 40.8% |
| Debt Instruments | 30.7% |
| Kotak Mahindra Prime Ltd. | 4.5% |
| REC Ltd. | 4.4% |
| Power Finance Corporation Ltd. | 4.4% |
| Shriram Finance Ltd. | 4.4% |
| Muthoot Finance Ltd. | 4.4% |
| National Bank For Agriculture and Rural Development | 4.4% |
| HDB Financial Services Ltd. | 4.3% |
| State Government Securities | 11.2% |
| 6.24% Maharashtra SDL (MD 11/08/2026) | 11.2% |
| Exchange Traded Funds | 15.0% |
| ICICI Prudential Gold ETF | 15.0% |
| Money Market Instruments | 0.2% |
| 364 Days Tbill (MD 07/03/2024) | 0.2% |
| Net Receivable/Payable | 2.2% |
| Grand Total | 100% |
1 Year |
Since Inception |
|||
CAGR (%) |
Current Value of Investment of ₹ 10,000 |
CAGR (%) |
Current Value of Investment of ₹ 10,000 |
|
| Scheme | 10.4 |
11,045 |
5.8 |
11,823 |
| Customised Benchmark (Benchmark) | 10.4 |
11,043 |
8.5 |
12,746 |
| Nifty 50 TRI (Additional Benchmark) | 16.2 |
11,628 |
22.7 |
18,442 |
| NAV (₹) Per Unit (11.8233 as on 31-July-2023) | 10.7044 |
10.0000 |
||
Date of inception: 04-Aug-2020. Incase, the start/end date of the concerned period is non business date (NBD), the NAV of the previous date is considered for computation of returns. The NAV per unit shown in the table is as on the start date of the said period. Past performance may or may not be sustained in the future. Performance is for Regular Plan Growth option. Different plans have different expense structure. Mr. Santosh Singh has been appointed as the Fund Manager for equity component with effect from 1-Jan-2022 and Mr. Rakesh Shetty is the Fund Manager for Debt, Gold and Silver Component since 22-Nov-2022 Mr. Ankush Sood has been appointed as the Fund Manager for For International Equity w.e.f. August 25, 2021.
1 Year |
Since Inception |
|||||
Scheme |
Customised Benchmark |
Nifty 50 TRI* |
Scheme |
Customised
Benchmark |
Nifty 50 TRI* |
|
| Invested Amount | 1,20,000 |
3,60,000 |
||||
| Market Value | 1,30,046 |
1,27,322 |
1,33,068 |
4,00,562 |
4,08,619 |
4,58,314 |
| Returns (XIRR) % | 15.96 |
11.56 |
20.90 |
7.07 |
8.42 |
16.36 |
| (as on 31-July-2023) | ||||||
* Also represents additional benchmark
For SIP returns, monthly investment of ₹ 10,000/- invested on the 1st day of every month has been considered. Performance is for Regular Plan Growth Option. Past performance may or may not be sustained in the future.

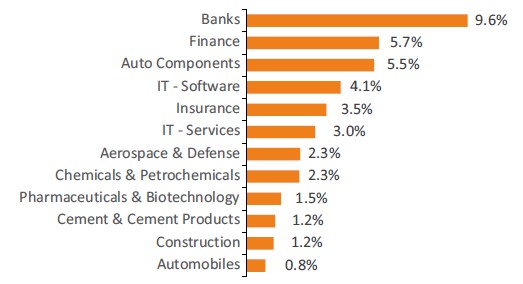
(Data as on 31-July-2023) Industry classification as recommended by AMFI
Regular Plan Growth Option |
₹ 11.8233 |
Direct Plan Growth Option |
₹ 12.2932 |
| (IDCW= Income Distribution cum capital withdrawal option) | |
Average Maturity |
1.67 Yrs |
YTM |
7.56% |
Macaulay Duration |
1.53 Yrs |
Modified Duration |
1.42 Yrs |
| Portfolio Turnover Ratio | 0.6 |
| (Data as on 31-July-2023) | |
Instrument Name |
Weightage% |
| Equity | 40.8 |
| Bonds & NCDs | 30.7 |
| State Government Securities | 11.2 |
| Exchange Traded Funds | 15.0 |
| Money Market Instrument (CD,CBLO & Treasury Bill) | 0.2 |
| Cash & Cash Equivalents | 2.2 |
| Total | 100.0 |
Month |
Domestic Equity |
International Equity |
Gold & Silver |
Debt* |
Total |
July-23 |
40.8% |
0.0% |
15.0% |
44.3% |
100.0% |
June-23 |
39.1% |
0.0% |
14.6% |
46.3% |
100.0% |
May-23 |
36.4% |
0.0% |
15.0% |
49.0% |
100.0% |
Apr-23 |
34.3% |
0.0% |
14.9% |
50.8% |
100.0% |
Mar-23 |
32.6% |
0.0% |
16.9% |
50.5% |
100.0% |
Feb-23 |
32.9% |
0.0% |
15.2% |
51.9% |
100.0% |
Jan-23 |
32.2% |
0.0% |
17.1% |
50.7% |
100.0% |
Dec-22 |
32.2% |
0.0% |
16.0% |
51.8% |
100.0% |
Nov-22 |
31.3% |
0.0% |
14.3% |
54.4% |
100.0% |
Oct-22 |
21.0% |
14.6% |
12.5% |
52.0% |
100.0% |
Sep-22 |
20.7% |
13.4% |
12.4% |
53.5% |
100.0% |
Aug-22 |
17.9% |
13.6% |
11.9% |
56.6% |
100.0% |
| *include CBLO & Cash & Cash Equivalents | |||||
- Long term capital appreciation by investing in a diversified portfolio.
- Investing in Equity including Index Funds/Equity ETFs, Gold ETFs and Silver ETFs, International Equity ETF and Stocks, Debt & Money Market Instruments.
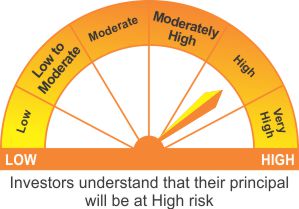
RISKOMETER |
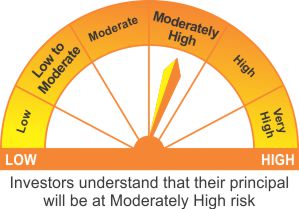
| BENCHMARK RISKOMETER 20% Nifty 50 TRI + 65% Crisil Short Term Bond Index + 13% Domestic Price of Gold + 2% Domestic Price of Silver  |